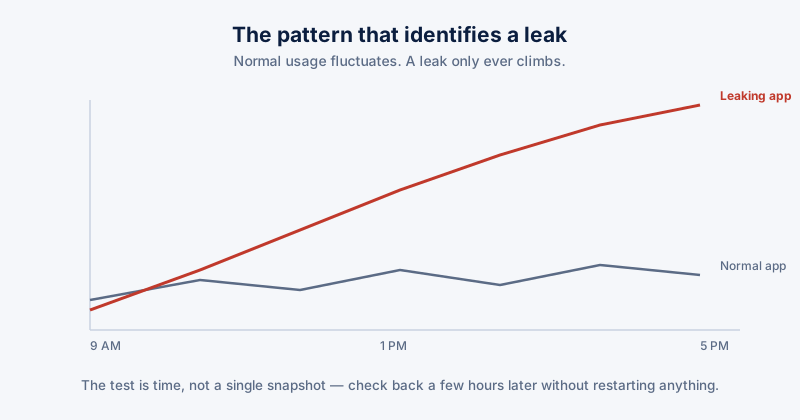
Freeing up RAM helps once. If memory usage climbs right back to the same point within a few hours, every time, that's not normal usage building up — it's a specific application failing to release memory it no longer needs, and it'll keep climbing until something forces it to stop.
The pattern that identifies a leak
Normal memory usage for an app fluctuates — it goes up while you're actively using a feature and comes back down once you're not. A leak looks different: usage climbs steadily over time and never comes back down, even when the app is sitting idle. The distinguishing test is time, not a single snapshot.
Finding the culprit
- Open Task Manager (Ctrl+Shift+Esc), go to the Processes tab, and sort by Memory
- Note which processes are using the most right now — then leave the PC running normally and check back in a few hours without restarting anything
- A process whose memory usage kept climbing over that window, without you doing anything that should explain it, is your suspect
- Browsers are a common source — check individual tab memory usage in Chrome/Edge's own Task Manager (Shift+Esc inside the browser) rather than just the browser's total, since one specific tab or extension is often the actual cause
A browser with many tabs open legitimately using a lot of memory is not the same thing as a leak — that's expected behavior for the number of tabs. The leak signature is usage climbing well past what the number of open tabs or active apps would explain, and not coming back down when you close things.
Common sources
- A specific browser extension — poorly-written extensions are one of the more common sources of a slow browser memory leak, and the effect can persist across tabs since the extension runs in the browser's own process space
- An app left running in the background for days without a restart — some genuinely accumulate memory over very long uptimes even without a true bug, simply from caching more than they release
- Outdated software with a known, since-fixed memory bug — checking whether a newer version is available is worth doing before assuming it's unfixable
What to do about it
- Update the suspected app (or browser extension) to the latest version first — genuine memory leak bugs get fixed regularly, and this is the lowest-effort fix
- If it's a browser extension, disable it and watch whether the pattern stops — this isolates the cause cleanly
- Restart the specific app rather than the whole PC if you've identified it — this reclaims the leaked memory without losing everything else you have open
- If it's a system process rather than a named app, and restarting doesn't help, that's a stronger signal worth investigating further rather than working around indefinitely
ETA System Doctor's Instant RAM Boost reclaims memory immediately when things feel sluggish, and its PC Health Score includes memory pressure as one of its six checks — useful for confirming whether what you're feeling is actually a memory problem before you go hunting for which specific app is responsible.